Proof
    Impress Blinds — cost per enquiry down 62.63%, $23.6 to $8.82SLS Solicitors — cost per enquiry down 58.48%, $84.64 to $35.14FixCare Property — cost per enquiry down 56.36%, $35.24 to $15.38Rubbish Removal WA — cost per enquiry down 53.18%, $71.02 to $33.25Floral Cakery — cost per enquiry down 49.82%, $13.83 to $6.94ILLUMINATE Laser Emporium — cost per enquiry down 48.54%, $138.65 to $71.35Aussie Plumbing — cost per enquiry down 41.96%, $117.75 to $68.34Sydney Fence Painting — cost per enquiry down 33.68%, $136.62 to $90.61Alliance Plumbing — cost per enquiry down 29.6%, $81.26 to $57.21Gridless Build Solutions — cost per enquiry down 29.16%, $78.16 to $55.37FacilityWorx — cost per enquiry down 23.62%, $157.13 to $120.01Cornerstone Roofing — cost per enquiry down 20.47%, $41.71 to $33.17A council finance platform — 194 of 194 requirements metA council finance build — 14 weeks to UAT, −34% 10-yr costA cultural institution — $634K of $750K kept workingA council platform — $470,106 built vs $503,262 SaaSA federal agency — n=5,000 prevalence survey at ±1.4%A civic mural — 36 concepts for a 71m × 9m wallA regional shire — 32-page visitor guide, 3 weeks earlyA shire council — one platform retiring 8 of 9 vendorsA pressure washing business — 138 jobs at A$20.43 eachA pressure washing business — 21.20% conversion rateA carpet cleaner — 53 jobs in 15 days at A$24.92 eachA roofing company — 68 quote requests in 35 daysA CCTV installer — 39 qualified leads in 15 daysA fence painter — 36 jobs in 24 days, quotes by day 3A maintenance business — live in 8 weeks, 3 stacks gone41 numbered clauses, published in full5.0 across every Google review$120M+ in media under management250+ active engagements across five countries

    Trauma-informed research Research that holds up — to scrutiny and to people.

    Population-scale, trauma-informed and statistically defensible, built for audiences where a badly-worded question does real harm. Validated instruments. Lived-experience co-design. A sovereign survey platform. An 1800 line that somebody answers.

    Division 04 of five · A national prevalence survey designed to a ±1.4% margin of error · Federal statutory agency · 2026

    Inside the study

    Seven ways research
    stops being usable.

    None of these are exotic. They are what we find when we are asked to review a study that did not land, and not one of them shows up in the executive summary.

    • A survey written for the analyst, not the respondent

      Thirty grid questions, no progress indicator and no way out. The people who drop out are rarely random — they are usually the ones with the most to say and the least patience for being processed.

    • Instruments repurposed from the wrong population

      A scale validated on one group and reused on another produces numbers that look rigorous and are not comparable to anything. The paper that validated it is the first thing to read, not the last.

    • Consent collected once, at the top

      A tick box on screen one does not cover the question on screen eleven. Consent has to be revisitable, and leaving has to be as easy at the end as it was at the start.

    • A helpline number with nobody behind it

      Printing a support number at the bottom of a distressing survey is not a duty-of-care plan. Somebody has to answer it, be trained for it, and be supervised by a clinician who reviews the calls.

    • Data offshore by default

      Most survey tools sub-process somewhere else and share infrastructure with thousands of other studies. For a sensitive population that is not a procurement detail — it is the reason people do not answer honestly.

    • A national number from a convenience panel

      Whoever happened to be in the panel that week is not a population. Without a stratified frame and a stated margin of error, the headline figure is a description of a mailing list.

    • Findings that arrive as a PDF nobody can act on

      Four hundred pages, no summary, no visual suite and no plain-English version. The study gets cited once in a media release and never influences a decision.

    How we design a study

    Two standards, neither traded against the other.

    A defensible statistical baseline is built once. Re-traumatising the people who answer is forever. Every decision on a study has to satisfy both the methodological standard and the human one.

    • ±1.4%

      margin of error

      On an n=5,000 stratified design for a Commonwealth prevalence study. Stated up front, not derived afterwards.

    • 4

      validated instruments

      PCL-5, K10, C-SSRS and AUDIT-C, plus ABS-comparable items — chosen for the population, never repurposed to fit.

    • 1800

      line, staffed not printed

      Trauma-informed operators under weekly supervision by a registered psychologist, with named escalation pathways.

    • AES-256

      at rest · TLS 1.3 in transit

      A sole-tenant AWS Sydney survey platform, Australia-only data path, no offshore sub-processing.

    • 2.2 AA

      WCAG conformance level

      Independently audited on every deliverable, with Auslan translation through accredited providers where needed.

    • 12

      infographic variants

      The standard visual reporting suite, alongside interactive dashboards and a plain-English summary report.

    So the difficult decisions get made before the field opens, not during it.

    Sampling frame, instrument, consent flow, hosting and duty of care are designed together, because on a sensitive study they are the same decision seen from different angles. A question you cannot support clinically is not a question you can ask, however useful the answer would be.

    That order also protects the numbers. Almost everything that goes wrong with a study — under-filled strata, biased drop-out, findings nobody can act on — is decided in the four weeks before anybody is invited to answer anything.

    Two programmes

    Federal statutory agency · prevalence

    5,000

    Target sample size

    Designed to a ±1.4% margin of error

    Federal innovation grant cohort

    $847.5K

    Programme funding

    Ten regional publishers researched as one cohort

    Federal statutory agency · reporting

    12

    Infographic variants delivered

    With interactive dashboards and a plain-English summary

    Figures describe the design and delivery of those programmes and are dated 2026. They are what those studies were scoped to do, for those populations, at those budgets — not a forecast for yours.

    Eleven things happen on a study. Here they are, in order.

    This is the part most research pages keep vague, and it is the part an ethics committee and a statistician will both read closely. So it is written down.

    1. Agree what the number has to survive

      Who will challenge this figure, and on what grounds? That answer sets the sampling frame, the sub-group power calculation and the margin of error before a single question is written.

    2. Bring lived-experience advisors in at design stage

      Not to review a finished draft. The people who have been through the thing being measured read the questions while they can still be changed, and they change them.

    3. Choose instruments that were validated for this population

      PCL-5, K10, C-SSRS, AUDIT-C and ABS-comparable items where a national benchmark matters. If nothing validated exists for a construct, we say so rather than borrowing something adjacent.

    4. Write skip-logic that protects, not just routes

      A distressing branch is not entered without warning, and it can be left from any screen without losing what has already been given. Opt-out is a first-class path, not an abandonment event.

    5. Build the platform, rather than renting one

      A sole-tenant AWS Sydney survey platform with AES-256 at rest, TLS 1.3 in transit and an Australia-only data path. On a sensitive study, where the data sits changes who is willing to answer.

    6. Staff the support line before the field opens

      Trauma-informed operators, trained on this instrument, under weekly clinical supervision by a registered psychologist, with escalation pathways agreed with the established national services in advance.

    7. Recruit like a campaign, screen like a study

      Posters, EDMs, QR cards, paid social and publication placements are made by the same creative team as our media work — then every respondent is screened against the frame before they count.

    8. Monitor the field daily

      Stratum fill, completion rate, drop-off point and qualitative flags on a live dashboard, with weekly written reporting. A stratum that is not filling gets a different recruitment approach, not a footnote.

    9. Report the limitations as prominently as the findings

      What the design can and cannot support, where the confidence intervals are wide, and which sub-groups were under-represented. A study that hides its limits gets found out by the first person who reads it properly.

    10. Deliver something a decision-maker can use

      A twelve-piece infographic suite, interactive dashboards and a plain-English summary alongside the technical report. The point of the research is the decision it informs.

    11. Hand the data over, and account for its disposal

      The dataset, the codebook and the analysis scripts are yours. Retention and destruction are agreed before the field opens and evidenced afterwards, because that is what the consent said.

    How an engagement runs

    From the sampling frame to the plain-English summary.

    1. Weeks 1–2

      The frame

      Population definition, stratification, sample size and the sub-group power calculation. This is where the margin of error is decided, and it cannot be improved later by analysis.

    2. Weeks 3–6

      Instrument co-design

      Validated measures selected, questions drafted, lived-experience advisors read and rewrite, skip-logic and opt-out paths mapped, and an ethics submission prepared where one is required.

    3. Before field

      Platform and duty of care

      Sovereign survey platform built and penetration-tested, 1800 operators trained and supervised, escalation pathways confirmed, and an independent accessibility audit completed.

    4. In field

      Recruit and monitor

      Recruitment creative in market, live dashboards on stratum fill, completion and drop-off, and weekly written reporting. Recruitment is re-pointed at whichever strata are lagging.

    5. Analysis

      Findings and limitations together

      Weighting, sub-group analysis and qualitative coding, with the limitations written at the same time as the findings rather than added at the end under a heading nobody reads.

    6. Handover

      The usable version

      Technical report, twelve-piece infographic suite, interactive dashboards, plain-English summary, dataset, codebook and scripts — plus the agreed retention and destruction record.

    The co-design phase is never shortened to hit a date. It is the four weeks that decide whether the rest of the study is worth running.

    SoudCoh Compound™

    Research work leans hardest on two of the six stages.

    Compound is how our team works on any engagement — six stages every change passes through. A study puts most of its weight on these two.

    • Meter

      If it cannot be measured, it does not get bought.

      The margin of error, the stratification and the sub-group power calculation are agreed before the instrument is written. A study that cannot state what it can and cannot support is not a study, it is a survey.

    • Ledger

      Every change we make becomes a record you can open.

      Instrument versions, ethics correspondence, field decisions, weighting choices and the retention and destruction record are all kept as a dated trail. It is what lets somebody else reproduce the finding in five years.

    Two programmes. Both federal.

    A national prevalence study for a sensitive population, and audience research across a ten-masthead publisher cohort. Government clients appear by sector and jurisdiction only.

    Federal statutory agency · Commonwealth · Prevalence research

    Complete · 2026

    A national prevalence survey designed to a ±1.4% margin of error.

    A population-scale study of a sensitive experience, for an audience where a badly-worded question does real harm. We designed the sampling frame, the instrument, the consent flow, the survey platform and the 1800 support line as one thing, because on a study like this they cannot be separated.

    5,000

    Target sample

    ±1.4%

    Margin of error

    12

    Infographic variants

    Federal statutory agency · 2026

    The problem

    A defensible number, from people it costs something to ask.

    A national figure needs a sampling frame and a margin of error that will survive scrutiny. The people who supply it are answering questions about the worst thing that has happened to them, on a screen, alone.

    Our approach

    Validated instruments, skip-logic that protects, help one tap away.

    PCL-5, K10, C-SSRS and AUDIT-C chosen for this population rather than repurposed, co-designed with lived-experience advisors, with opt-out on every screen and a trauma-informed 1800 line under clinical supervision.

    What we delivered

    • n=5,000 target design at a ±1.4% margin of error
    • Validated instruments — PCL-5, K10, C-SSRS, AUDIT-C
    • Sovereign AWS Sydney sole-tenant survey platform
    • Trauma-informed 1800 line with weekly clinical supervision
    • Twelve-piece infographic suite plus a plain-English summary
    • WCAG-conformant survey with an independent accessibility audit

    Federal innovation grant cohort · Federal · Commercial sustainability

    Complete · 2026

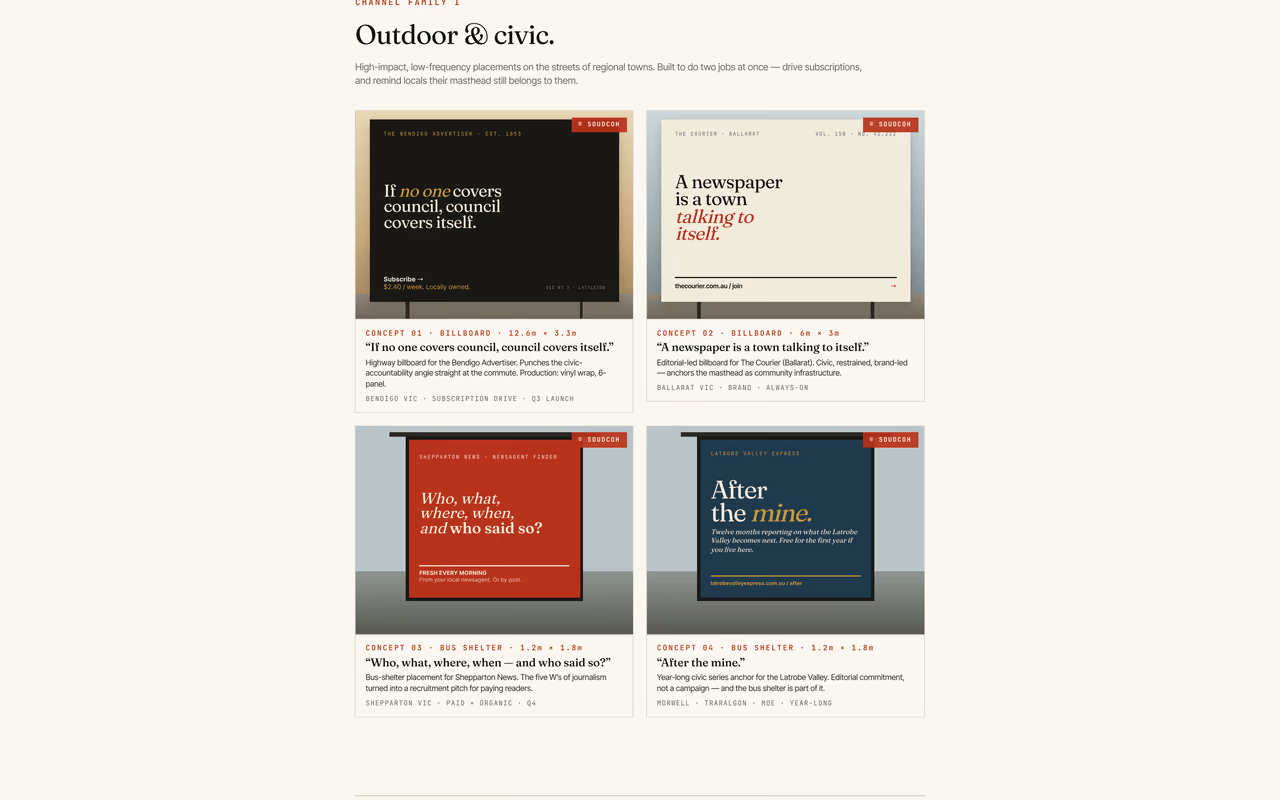
    Regional masthead billboards

    Regional masthead billboards across the publisher cohort

    1 / 4

    A regional-mastheads platform for 10 Australian publishers.

    Ten regional publishers were each spending $80K–$140K/yr reinventing identical infrastructure — subscription pages, newsletter stacks, ad inventory, audience research. We designed a shared productised platform plus 20-concept brand kits per masthead, released to the wider Australian regional news sector under Creative Commons at project end.

    Programme funding
    $847.5K

    Programme funding

    Publishers in cohort
    10

    Publishers in cohort

    Subscription target
    +22%

    Subscription target

    The problem

    Ten newsrooms, ten times the same plumbing.

    Subscription, paywall, member management, newsletter, ad-sales — every regional publisher rebuilds the same infrastructure with a different small agency. Effort is duplicated. Money goes to discovery cost. Readers see a fragmented industry.

    Our approach

    One shared codebase, masthead-configured.

    Shared subscription + paywall + member-management platform, 20-concept brand kit per masthead across outdoor/print/digital/audio, ad-sales playbook, audience research, 14 in-newsroom workshops and a Creative-Commons sector release at month 19.

    What we delivered

    • Shared subscription / paywall / member-management codebase
    • 20-concept brand kit per masthead — outdoor, print, digital, audio
    • Regional ad-sales playbook + rate cards + outbound assets
    • Quantitative + qualitative audience research per cohort masthead
    • 14 in-newsroom workshops, evaluation reporting, CC sector release
    • Targets: +22% paid subscription conversion across 480k readers

    Before you commission anything

    Here is what everybody asks first.

    FAQ

    Research, answered.

    Cost, timeline, who owns the data, what happens if the sample does not fill, how respondents are protected, and where the data lives.

    The first conversation is free and there is no deck.

    Talk to this division

    It is scoped and fixed rather than run on an hourly rate, and the fixed price is what a Commonwealth pricing schedule needs. A national prevalence study — sampling frame, instrument co-design, sovereign platform, recruitment, a staffed 1800 line, analysis and a twelve-piece visual suite — was delivered on a fixed fee inside its published ceiling. Smaller audience-segmentation studies for marketing work are a fraction of that. The first conversation gives you a real number.

    A population-scale study is usually six to nine months end to end: two weeks on the frame, four on instrument co-design with lived-experience advisors, then platform build, ethics where required, field period, analysis and reporting. Audience research feeding a marketing engagement runs in weeks rather than months. We give you the phase dates before you commit, and we do not shorten the co-design phase to hit a date.

    No. Research is scoped as a defined programme with defined deliverables, and the deliverables are yours as they are produced — the dataset, the codebook and the analysis scripts, not just the report. Where a study runs in phases, each phase can be reviewed before the next is authorised.

    You do. The dataset, the codebook, the analysis scripts and the report are handed over, and the survey platform is sole-tenant, so your data was never pooled with anybody else's. Retention and destruction are agreed before the field opens and evidenced afterwards, because that is what respondents were told when they consented.

    You hear it from us in the weekly report while there is still time to act, not in the final findings. Live dashboards show stratum fill and drop-off daily, and recruitment is re-pointed at the strata that are lagging. If a sub-group cannot be filled to a defensible level, we report that as a limitation rather than quietly weighting around it.

    A weekly written report plus live dashboards you can open yourself: stratum fill, completion rate, where people are dropping out, and any qualitative flags that need attention. After analysis you get a technical report, a twelve-piece infographic suite, interactive dashboards and a plain-English summary written for people who will never read the methodology.

    Lived-experience advisors co-design the instrument. Skip-logic warns before a distressing branch and lets people leave from any screen without losing what they have already given. Support is one tap away throughout, and the 1800 line is staffed by trauma-informed operators under weekly supervision by a registered psychologist, with escalation pathways agreed with the established national services before the field opens.

    On a sole-tenant survey platform we build and host on AWS Sydney — AES-256 at rest, TLS 1.3 in transit, an Australia-only data path and no offshore sub-processing. On a sensitive study this is not a procurement detail: where the data sits changes who is willing to answer honestly, and it is one of the first questions an ethics committee asks.

    PCL-5, K10, C-SSRS and AUDIT-C are the validated measures we reach for most often, alongside ABS-comparable items where a national benchmark matters. Each is chosen because it was validated on a comparable population, not because it is familiar. Where nothing validated exists for a construct we say so and design a bespoke item set with its limitations stated.

    WCAG 2.2 AA is the baseline, built in from the first screen and then independently audited rather than self-declared. Auslan translation is available through accredited providers, and where the population is multilingual we field in multiple languages. An inaccessible survey does not just exclude people — it biases the result, which makes it a methodological problem as well as an ethical one.

    Yes, and the two feed each other. Quantitative and qualitative segmentation studies run for our marketing clients use the same sampling discipline as the government work, at a scale that suits a commercial budget. The output goes straight into audience strategy rather than sitting in a deck — which is the whole reason we run research in-house.

    We prepare ethics submissions where a study needs one and design to the committee's requirements from the start rather than retrofitting to them. Clinical governance sits with a registered psychologist who supervises the support operation weekly. We do not present ourselves as the approving body — that is the committee's role, and the study is designed to be approvable by one.

    A study usually starts in one division and finishes in three.

    Most engagements start in one division and pull in a second. All five divisions sit side by side on one page, if you would rather start there.

    Brief us on the study

    Tell us what has to be measured and who will challenge the number. We come back with a frame, a margin of error and an honest view of whether the study is worth running.

    No pitch deck. A real conversation about what the research can and cannot support.