
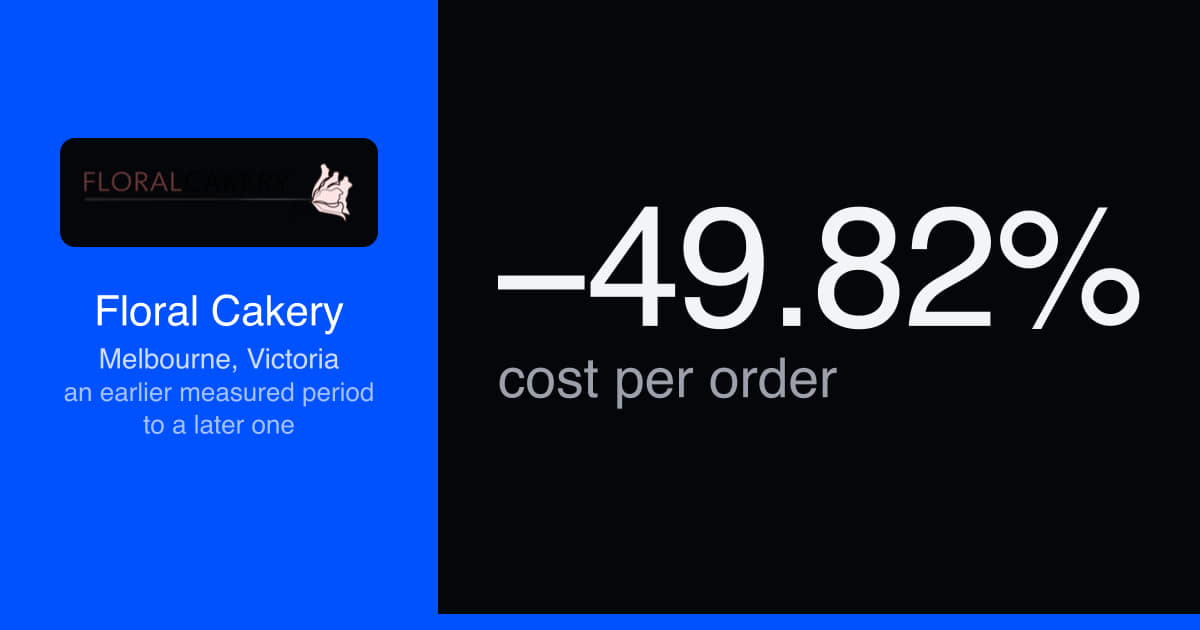
Cakes Melbourne: cost per order down 49.82% to $6.94
Floral Cakery · Cake and cupcake boutique — online orders, weddings and corporate · Melbourne, Victoria
The short version · an earlier measured period to a later one
A Melbourne cake boutique was paying $13.83 an order in one measured period.
By a later one it was $6.94, and the account went on to produce 997 orders at an average of $10.12 each. The periods below are picked out of the account and reported without dates, deliberately.
The result.
−49.82%
cost per order
an earlier measured period to a later one
$6.94
cost per order
a 30-day period
137
orders in the measured period
a later 30-day period
7.48%
conversion rate
a 31-day period
997
tracked orders
across the account's wider run
- Industry
- Cake and cupcake boutique — online orders, weddings and corporate
- Discipline
- Retail & e-commerce
- Ad spend band
- $10K–$25K
- Measured over
- an earlier measured period to a later one
Every figure above was read out of this client's live account and is reproduced exactly as the study publishes it. It is a record of what happened on one account, in one market, at one budget — not a forecast for yours.
What would this look like on your account?
Different market, different budget, different numbers. The first call is where we work out whether the same approach fits yours at all.
The case study
What moved for Floral Cakery.
The short list
- Cost per order fell from $13.83 to $6.94 between an earlier measured period and a later one — a 49.82% drop.
- The cheaper period was not the smaller one: it produced 109.83 orders across 30 days, from 1,483 clicks.
- A 31-day period recorded the account's best conversion rate at 7.48%, from 117 orders at $7.37 each.
- 997 tracked orders across the account's wider run, at an average of $10.12 each, from 16,674 clicks.
- On a boutique cake, a few dollars of wasted ad cost is not a rounding error. It is a real slice of the margin on that order, gone before the oven is on.
Each line above belongs to the period printed with it. None of them is an average across the account, and none of them is a forecast.
Cake is a calendar business
Floral Cakery is a Melbourne cake and cupcake boutique — online orders for next-day delivery, plus weddings and corporate work. Nobody buys a cake speculatively. There is a birthday on Saturday, a farewell in the office on Thursday, a wedding in four months.
Demand arrives in spikes and the decision gets made fast. Someone is on a tram comparing three or four bakeries on a phone screen, and the bakery that answers the question actually in their head — can you get one to me tomorrow — takes the order.
The commercial difficulty is the size of the average basket. On a boutique cake, a few dollars of wasted ad cost is not a rounding error. It is a real slice of the margin on that order, gone before the oven is on.
Paying too much to reach people who already wanted to buy
In an earlier measured period the account was paying $13.83 for every order it produced. Demand was never the issue — Melbourne wants cake. The problem was the price of reaching people who were already looking, and at $13.83 the channel could never scale to the volume the kitchen could actually handle.
Seasonal businesses also punish inattention in a particular way. Leave an account alone and it drifts towards the cheapest, most curious traffic on the internet, because that traffic is always available and never in short supply.
What "wrong traffic" looks like when you sell cake
It rarely looks obviously wrong. Somebody wants a recipe, not a bakery. Somebody is after a cake in a city the delivery van will never reach. Somebody is pricing a hundred-guest wedding when the search that brought them in was about cupcakes.
Each of those clicks costs the same as a click from a person with a card out and a delivery date in mind. Multiply that across a month and a boutique ends up funding a lot of reading. The work is telling those groups apart quickly, then keeping them apart as the mix shifts from one week to the next.
What we took on
Three campaigns, running without a gap. Every period named below is one we picked out and left undated on purpose. Taken over the whole account rather than one window, the work has served 567,501 impressions, taken 16,674 clicks and produced 997 orders, with only one soft month in the record.
We rebuilt it around the orders that get baked and delivered, and wrote the ads to the occasion the customer was buying for rather than to the category. In a business that moves with the calendar, the ongoing work matters more than the setup. Demand shifts week to week; the same account has to serve a wedding being planned months out and a birthday nobody remembered until Thursday. Keeping it productive month after month is a grind, and that grind is where most of the improvement came from.
Cost per order cut in half
The earlier period sat at $13.83 per order. By the later one it was $6.94, a fall of 49.82%. That cheaper period also produced 109.83 orders in its own right across 30 days, from 1,483 clicks and 63,141 impressions, so halving the cost did not mean halving the output.
The line chart shows the drop and, more usefully, shows it holding through the months that follow. The bars underneath say the same thing from the volume side: the cheaper months were not the small ones.
That distinction is the one worth checking in any account, including your own. Cost per order falls very easily if you simply stop bidding on the expensive half of the market, and the chart looks wonderful right up until somebody counts the cakes. Here the count went the other way — the cheaper period produced 109.83 orders while costing $6.94 each, which is a better month on both measures at once.
Then it scaled without giving the efficiency back
A 31-day period recorded the highest conversion rate the account has managed at 7.48%, from 117 orders at $7.37 each. The period straight after it was the biggest for volume, with 137 orders at $9.88 each, off 1,995 clicks in 30 days.
997 orders taken over the whole account rather than one period, at an average of $10.12 each.
- $13.83 → $6.94 cost per order, from an earlier measured period to a later one — a 49.82% drop
- 109.83 orders in that cheaper period, across 30 days, from 1,483 clicks
- 117 orders at $7.37 each in a 31-day period, at a 7.48% conversion rate
- 137 orders at $9.88 each in the 30-day period that followed, from 1,995 clicks
- 997 orders across the account's wider run, at an average of $10.12 each
- 2.94% click-through rate and a 5.98% conversion rate on the same account-wide basis
What it meant for the kitchen
997 orders at $10.12 apiece is a channel a small kitchen can build a roster around. Cake work is capacity-constrained — there are only so many decorating hours in a week — so a cheaper order is worth more than the margin it saves. It buys the freedom to turn the tap up when the diary looks light, and to keep the same economics when it is full.
The consistency is the quiet win here. A boutique that only performs in the run-up to the year's one big gifting week lives at the mercy of the calendar. Month after month holding its shape, with the best conversion rate and the best volume both landing well outside any obvious peak, says the account is producing work right through the calendar rather than waiting for the season to do the selling for it.
Predictability matters for a kitchen in a way it does not for a warehouse. Ingredients get ordered, casual hands get rostered and delivery runs get planned days before the cake is decorated. Knowing roughly what an order costs to win is what turns all of that from a guess into a plan.
The 16,674 clicks are worth one last look, because they are the part that gets misread most often. Traffic on its own tells you almost nothing about a business. 997 of those visits turned into an order, at a 5.98% conversion rate — that is the sentence a kitchen can act on, and it is the only one on the page that maps directly to a delivery run.
Start a conversation
If people buy from you because of a date on a calendar, the gap between a good account and an average one shows up in dollars per order, not in impressions. Send us your numbers and we will tell you which one you are running, and roughly what it would take to move.
Tags
- Cake and cupcake boutique — online orders, weddings and corporate
- Melbourne, Victoria
- $10K–$25K
That is one account. Yours is a different one.
We read your ads, your search presence and your tracking the same way this one was read, and tell you what we would change first.
What every number on this page actually means.
Marketing words get used loosely, and a loose word can make a small result look like a big one. Here is exactly what we mean by each of them.
- Conversion
- One real action by one real person: a phone call that lasted long enough to be a conversation, a submitted enquiry form, a booking, or a purchase. Not a page view and not a form that merely loaded.
- Cost per job · cost per lead
- The advertising money spent, divided by the number of those actions. It is the only figure that tells you whether the advertising is worth doing, which is why we publish it next to the count.
- Conversion rate
- The share of people who clicked the ad and then did the thing. A high click count with a low conversion rate usually means the ad and the page are promising different things.
- Ad spend
- Money that went to the advertising platform, not to us. Our management fee is separate and is never included in a cost-per-job figure, because mixing them would flatter the number.
- The measurement window
- The dates the figure covers, named every time. Where a study covers a launch, the clock starts the day campaigns went live — not the day the graph started looking good.
- A starting point
- Where a study knows what a figure was before the work began, that number is printed next to the one it became. Where the account had no history to compare against, the result is printed on its own rather than measured from a number nobody recorded.
- Qualified lead
- An enquiry that matched the service and the service area, so it was worth someone picking up the phone for. Where a study says qualified, somebody checked.
- An anonymised client
- Government, council and cultural-institution engagements are published as sector and jurisdiction only. The work and the measured outcome are described in full; the organisation is not named.
One more, because it matters most: nothing on this page is a guarantee. It is a record of what happened on one account, in one market, at one budget.
What this study cannot tell you is what the same figure looks like on your account — so the ROAS you have to clear to break even, with your own click price and close rate. It takes about a minute and asks for nothing.
This page exists because of two of the six stages.
Compound is how our team works on any account — six stages every change passes through. Two of them are why there is anything honest to publish.
Meter
If it can't be measured, it doesn't get bought.
Before a dollar moves, every action worth money to the business is tracked as itself — calls, forms, bookings, purchases — with values attached. Without that stage there is no honest number to publish afterwards.
Ledger
Every change we make becomes a record you can open.
Every change lands in a dated record as it happens — what was added, what was stopped, what was rewritten and what it cost. Writing this page afterwards was reading a file, not reconstructing a memory.
What actually happens after the first call.
No mystery and no lock-in before you have seen anything. This is the sequence every account on this site went through.
- The call
Thirty to forty-five minutes, free
What you sell, who buys it, and what one customer is worth to you. No deck. You leave with a real number for your situation rather than a range.
- Week 0
The audit
We open your account — or your competitors' ground, if you do not have one yet — and write down every leak we can find. That list is yours whether or not you work with us.
- Week 1
The build
Everything the account needs before it can spend a dollar: what it will bid on, what it must never pay for, the ad copy, the assets, the landing pages and the tracking. A second person checks all of it before anything is live.
- Day one
You press go
Campaigns are created paused, every time, so you can read the whole build first. You activate when you are ready, not when we are.
- Days 1–14
The clean
The busiest fortnight your account will ever have. Search terms read daily, waste negated, early winners promoted, ad copy iterated against what is actually being served.
- From there
Rhythm
Weekly optimisation, reporting on a fixed cadence whether the news is good or bad, and a proper conversation each quarter about where the next block of budget should go.
Before you ask us anything
Here is what everybody asks first.
The questions this raises.
Whether the figures are real, how they were measured and over what length of window, what it costs, and whether any of it would hold for your business.
The first call is free and there is no deck.
Book a callWhat does a cake order cost to win on Google Ads?
In this account, $6.94 in the cheapest of the periods we are reporting, $7.37 and $9.88 in two later ones, and $10.12 averaged across the account's wider run. The earlier period sat at $13.83. For a boutique with a small average basket, that spread is the difference between a channel that can scale to what the kitchen can handle and one that cannot.
Does halving the cost per order mean halving the orders?
It did not here, and that is the distinction worth checking in any account. Cost per order falls very easily if you simply stop bidding on the expensive half of the market, and the chart looks wonderful right up until somebody counts the cakes. The cheaper period produced 109.83 orders in its own right across 30 days, and the biggest window for volume followed with 137 orders off 1,995 clicks.
Does a cake business only perform around the big gifting weeks?
Not on this record. The best conversion rate the account has managed, 7.48%, and its strongest window for volume both landed well outside any obvious peak. That matters more to a kitchen than to a warehouse: ingredients get ordered, casual hands get rostered and delivery runs get planned days before the cake is decorated, so a channel that only performs in one week of the year cannot be rostered around.
Is 16,674 clicks a good result?
Traffic on its own tells you almost nothing about a business, and it is the figure that gets misread most often. 997 of those visits turned into a tracked order, at a 5.98% conversion rate across the account's wider run. That is the sentence a kitchen can act on, and it is the only one that maps directly to a delivery run.
Are the figures in this Floral Cakery case study real?
Yes. Every number on this page was read out of the client's own advertising account and is printed here exactly as the study publishes it, beside the period it covers. The dashboard and ad images are screen-grabs of that account rather than recreations. If one of these figures matters to your decision, ask about it on the first call and we will walk you through where it came from.
How were these numbers measured, and over what window?
The headline figure covers an earlier measured period to a later one, and every other figure on the page is printed beside the period it belongs to. We publish the LENGTH of a measurement window and the year, and withhold the exact dates — when a client advertised, and how their trading calendar looks, is their commercial information rather than ours. A conversion means one real action by one real person: a phone call that lasted long enough to be a conversation, a submitted enquiry form, a booking, or a purchase. Not a page view, and not a form that merely loaded.
How much was being spent to produce this?
The study publishes this account's advertising spend as a band — $10K–$25K — rather than an exact figure, because the precise number is the client's business. Our management fee is separate from that and is never folded into a cost-per-lead figure anywhere on this site; mixing the two would flatter every number on the page.
Would this work for my business?
We cannot promise you the same numbers, and nobody honestly can. What this page tells you is what was achievable in that market, at that budget, for that service. Your competition, your service area, your margins and what one customer is worth to you all move the answer. On the first call we build the picture from your figures rather than someone else's, and if the honest answer is that this channel is wrong for you right now, we will say so.
More accounts, same discipline.
Studies from the same kind of work, so you can see how the pattern holds across different businesses.
Retail & e-commerce
Made-to-measure blinds UK: cost per order down 62.63%
How a UK made-to-measure blinds retailer cut cost per order 62.63% to A$8.82 and later recorded a 17.47% conversion rate across a 31-day period.
Read case study
Plumbing
Plumbing leads Sydney: cost per lead down 41.96%
How a Sydney plumbing company cut cost per lead 41.96% to $68.34 and booked 247 enquiries in a 31-day period in 2026, its best month. Plumbing lead generation, Sydney.
Read case study
Electrical
Electrician leads Sydney: 262 enquiries in a 30-day period
How a Sydney electrical contractor reached 262 enquiries in a 30-day period in 2026 and 260 at $65.01 each in the 31-day period before it. Electrician lead generation across Sydney.
Read case study
The work that produced this.
Everything above was delivered by one of a handful of things we do. These are the ones this account leant on, written up in full rather than summarised.
- SEO for stores and product cataloguesCategory architecture, product-page templates and the technical work a store needs before paid traffic is worth buying.
- Shopping campaigns and the product feedFor a store the product feed does the work ad copy does elsewhere. This is what it takes to get a catalogue earning rather than just listed.
- Advertising a product people buy on sightRetail is the category paid social was built for. Placement-specific creative, not a resized banner.
The briefing behind the work.
The case study records what happened. These two explain the channel, measurement or operating decision that made the result interpretable in the first place.
A review process that follows a real completed job and stays inside Google's rules. That case is argued in Review requests that do not sound automated.
The external entity data underneath any local-service acquisition programme. The other half of it is set out in The citation inconsistencies that still move local rankings.
The work behind this one is written up in full under seo for stores and product catalogues, and the ninety-day plan that produced results like these sets out the sequence in order.
Want results like this?
Thirty minutes on your numbers rather than somebody else's, and a written list of what we would change first. Yours to keep either way.
No pitch deck. No upsell. A real conversation and a written list of leaks.