    Proof
    Impress Blinds — cost per enquiry down 62.63%, $23.6 to $8.82SLS Solicitors — cost per enquiry down 58.48%, $84.64 to $35.14FixCare Property — cost per enquiry down 56.36%, $35.24 to $15.38Rubbish Removal WA — cost per enquiry down 53.18%, $71.02 to $33.25Floral Cakery — cost per enquiry down 49.82%, $13.83 to $6.94ILLUMINATE Laser Emporium — cost per enquiry down 48.54%, $138.65 to $71.35Aussie Plumbing — cost per enquiry down 41.96%, $117.75 to $68.34Sydney Fence Painting — cost per enquiry down 33.68%, $136.62 to $90.61Alliance Plumbing — cost per enquiry down 29.6%, $81.26 to $57.21Gridless Build Solutions — cost per enquiry down 29.16%, $78.16 to $55.37FacilityWorx — cost per enquiry down 23.62%, $157.13 to $120.01Cornerstone Roofing — cost per enquiry down 20.47%, $41.71 to $33.17A council finance platform — 194 of 194 requirements metA council finance build — 14 weeks to UAT, −34% 10-yr costA cultural institution — $634K of $750K kept workingA council platform — $470,106 built vs $503,262 SaaSA federal agency — n=5,000 prevalence survey at ±1.4%A civic mural — 36 concepts for a 71m × 9m wallA regional shire — 32-page visitor guide, 3 weeks earlyA shire council — one platform retiring 8 of 9 vendorsA pressure washing business — 138 jobs at A$20.43 eachA pressure washing business — 21.20% conversion rateA carpet cleaner — 53 jobs in 15 days at A$24.92 eachA roofing company — 68 quote requests in 35 daysA CCTV installer — 39 qualified leads in 15 daysA fence painter — 36 jobs in 24 days, quotes by day 3A maintenance business — live in 8 weeks, 3 stacks gone41 numbered clauses, published in full5.0 across every Google review$120M+ in media under management250+ active engagements across five countries
    Custom Web App

    Msaha Internal Dashboard - AI-Powered Marketplace Operations Platform

    Technology & Media

    The short version

    SoudCoh built Msaha's internal dashboard for managing 3,562+ hosts and tenants across Saudi Arabia.

    AI matching, pipeline tracking, closed lost intelligence, and geographic analytics in one platform.

    The result.

    3,562

    Total Records Tracked

    407

    Hosts Onboarded

    3,154

    Tenants in Pipeline

    2,677

    Closed Lost Reasons Documented

    Industry
    Technology & Media
    Discipline
    Custom Web App
    Services
    Custom Web App · Dashboard · CRM & Automation · Lead Generation

    Every figure above was read out of this client's live account and is reproduced exactly as the study publishes it. It is a record of what happened on one account, in one market, at one budget — not a forecast for yours.

    What would this look like on your account?

    Different market, different budget, different numbers. The first call is where we work out whether the same approach fits yours at all.

    Msaha Internal Dashboard - AI-Powered Marketplace Operations Platform

    The case study

    3,562 Total Records Tracked
    407 Hosts Onboarded
    3,154 Tenants in Pipeline
    2,677 Closed Lost Reasons Documented

    About Msaha

    Msaha is the "Airbnb for commercial kitchens" in Saudi Arabia. The platform helps restaurants turn idle kitchen hours into income while giving food brands a faster way to launch without heavy overheads. SoudCoh built Msaha's internal dashboard so their team could track hosts and tenants, manage leads, and make smarter matches at scale. The goal was one clear control room - not a messy mix of spreadsheets, WhatsApp threads, and guesswork.

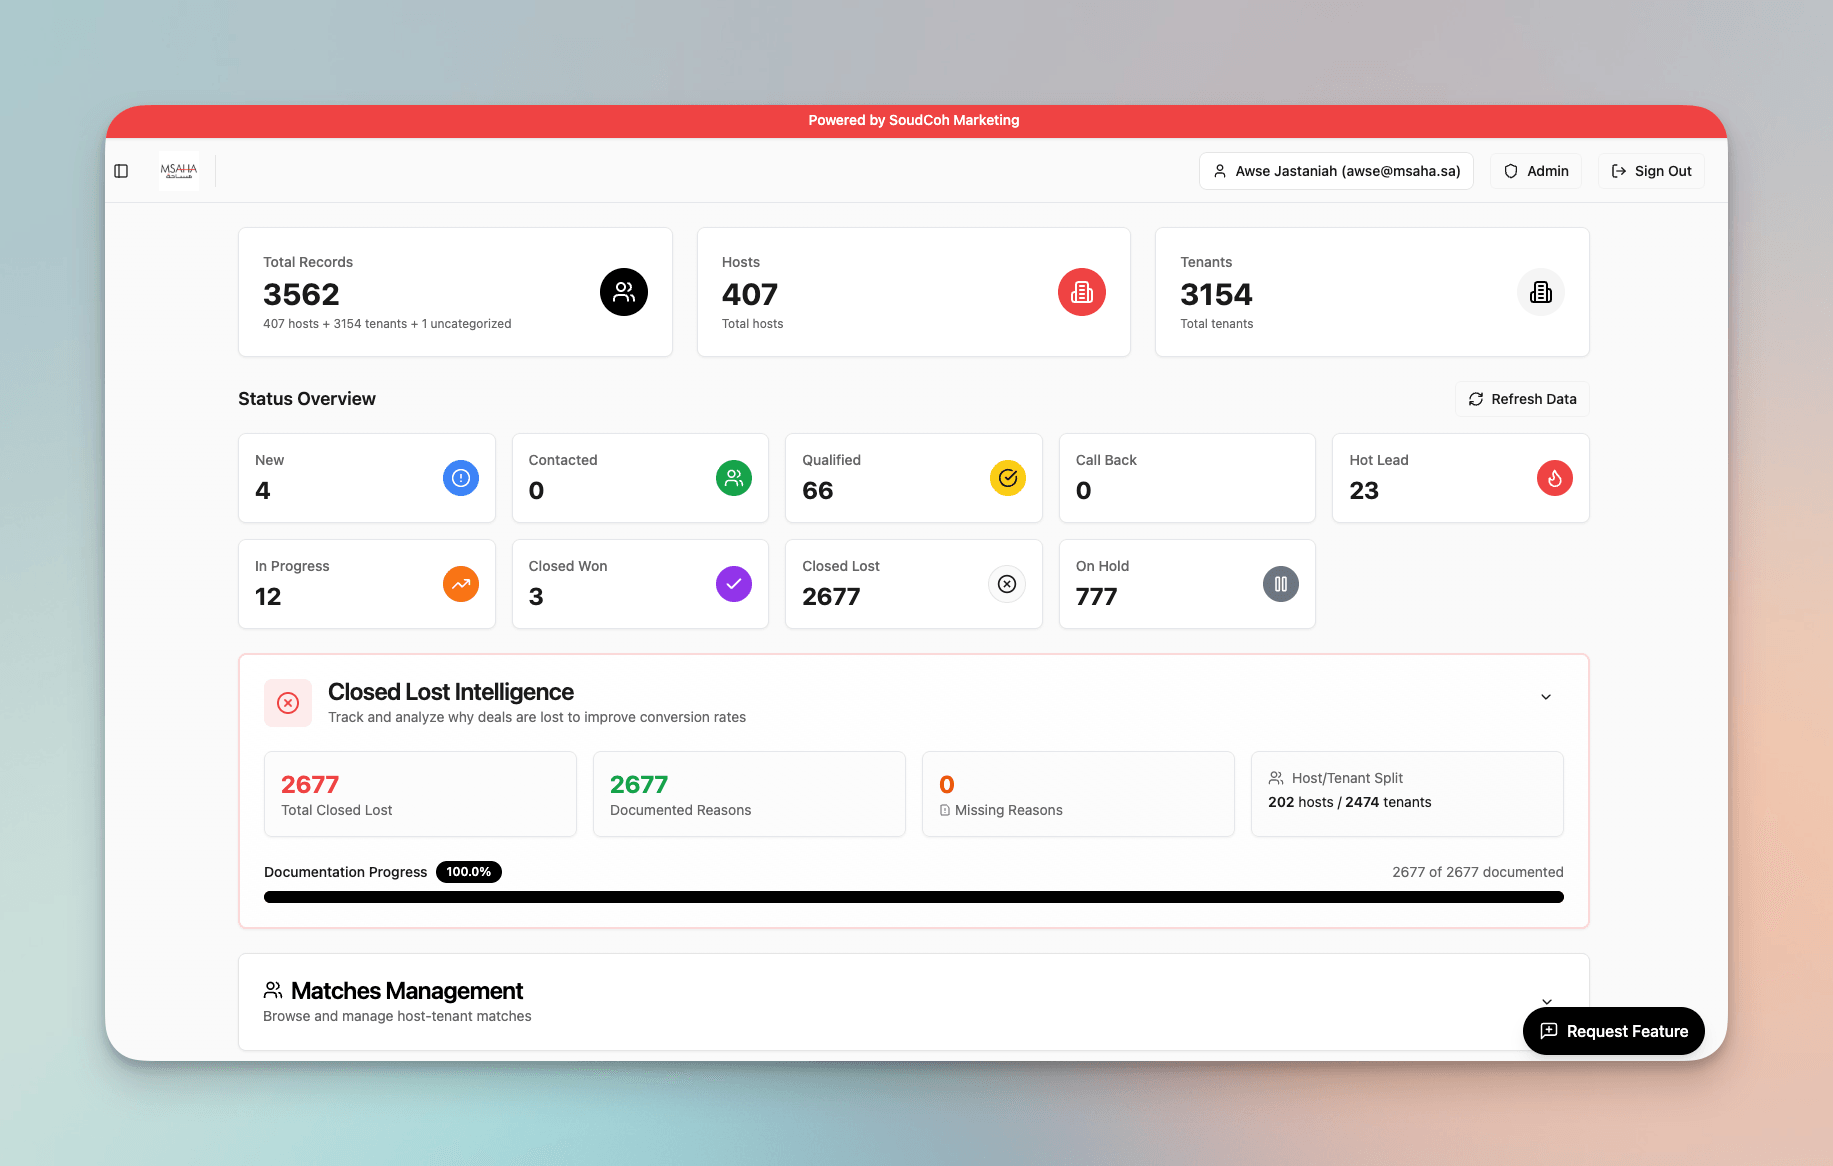
    Msaha internal dashboard showing total records, hosts, tenants, status overview, and closed lost intelligence

    The Challenge

    Msaha's marketplace model looks simple from the outside: hosts list kitchens, tenants book them, everyone wins. Behind the scenes, managing hundreds of hosts and thousands of tenants required a dedicated platform to keep growth organised and matching quality high.

    Too many moving parts

    Hosts, tenants, kitchens, locations, availability, equipment, and budget all change constantly. Manual tracking could not keep up with the volume.

    Matching needed to be smarter

    A good match depends on more than price. Location, shift timing, equipment compatibility, and kitchen readiness all matter for successful placements.

    Lead management was scattered

    New enquiries, follow-ups, callbacks, and hot leads were hard to prioritise without a single source of truth for the operations team.

    No clear view of conversion blockers

    When deals were lost, the reasons often disappeared. Without documented data, improving conversion felt like guessing.

    Msaha did not just need another tool. They needed a purpose-built internal dashboard that made operations faster, matching sharper, and performance visible in real time.

    Our Strategic Approach

    SoudCoh approached this like a growth engine, not just a web app build. The goal was to give Msaha a clean operating system for their marketplace: capture every record, keep the pipeline moving, and use AI-driven logic to improve host-tenant matching over time. Everything was designed to be simple for staff, powerful for reporting, and ready to scale.

    One Dashboard for the Whole Marketplace

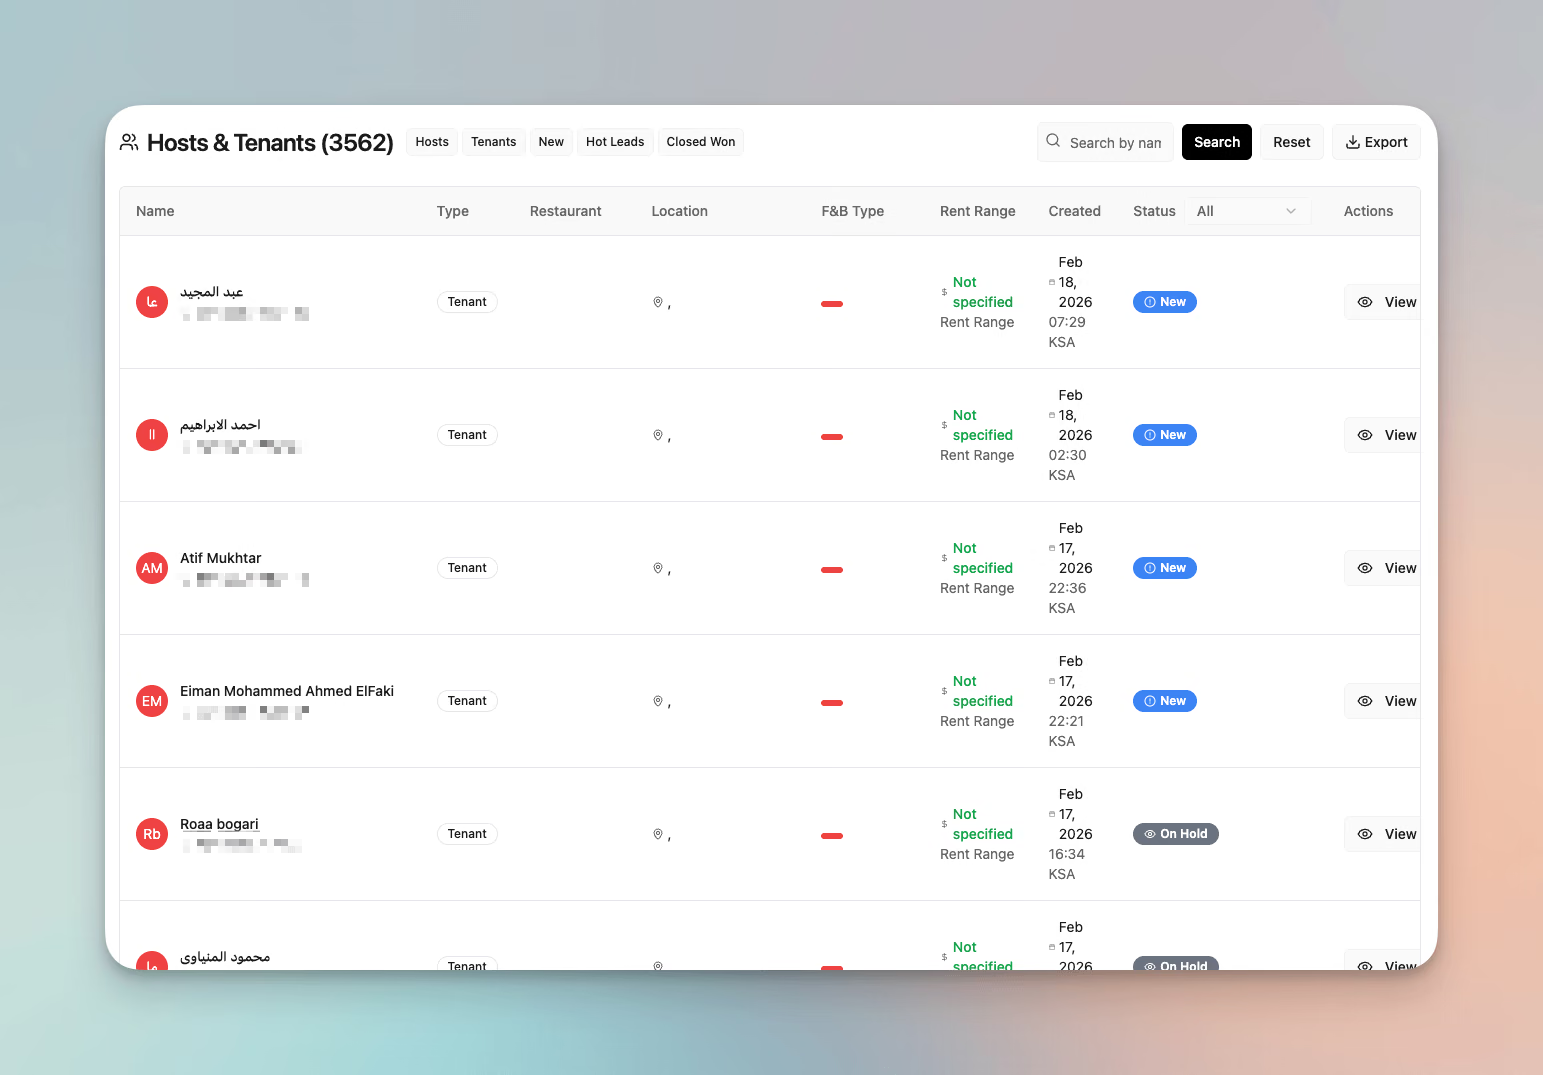
    We built a central dashboard that brings hosts, tenants, statuses, and outcomes into one clean view. No hunting through disconnected tools or duplicated data. The team can see what is new, what is qualified, what is hot, and what is stuck at a glance. This kind of setup keeps operations calm even when demand spikes across multiple Saudi cities.

    Msaha hosts and tenants management list with status filters, search, and export functionality Msaha host contact detail view showing status, contact information, location, and business details

    AI Host-Tenant Matching

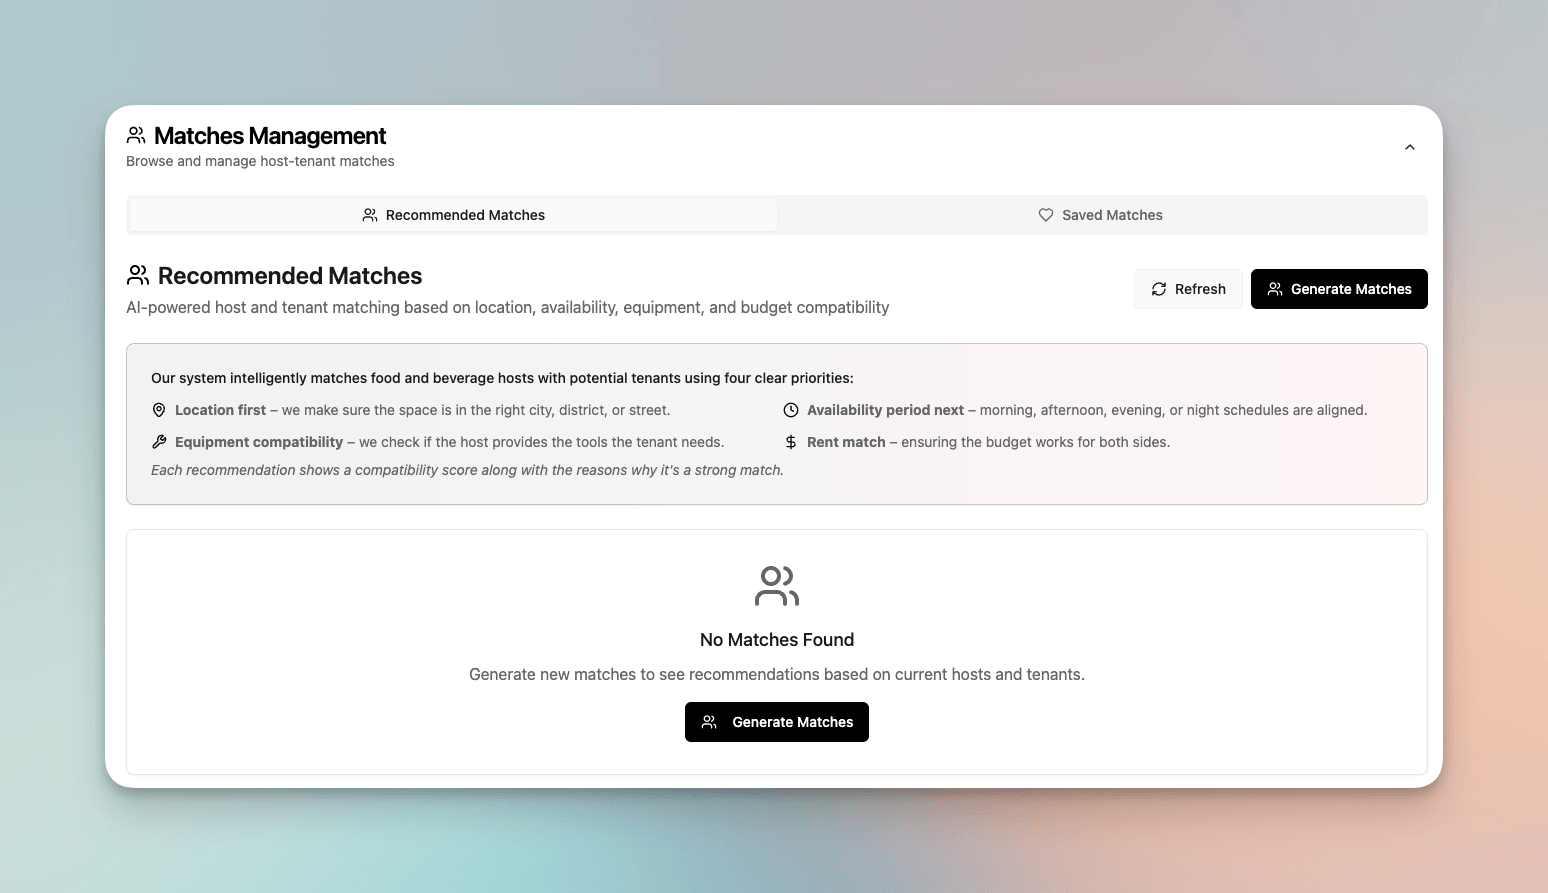
    Msaha's matching feature uses clear priorities - location first, then availability, equipment compatibility, and rent alignment. We structured the matching engine so staff can generate recommendations quickly and understand exactly why a match is strong. This builds trust in the system and helps the team move faster on the right opportunities without second-guessing.

    Msaha AI-powered matches management showing recommended matches with location, availability, equipment, and budget compatibility

    Pipeline Workflow That Drives Action

    We implemented a practical status system covering New, Qualified, In Progress, Hot Lead, Closed Won, Closed Lost, and On Hold stages. The team always knows the next step for every record. This turns lead management into a rhythm: qualify fast, follow up consistently, and keep the pipeline moving without losing good tenants in the noise.

    Closed Lost Intelligence

    Instead of letting failed deals vanish, we built a Closed Lost Intelligence layer that tracks reasons at scale. The team can instantly see patterns - whether leads are unresponsive, a poor fit, just browsing, or facing price objections. With 2,677 closed lost reasons fully documented and 100% documentation progress, Msaha now has a feedback loop to refine targeting, improve onboarding, and lift conversion rates without guesswork.

    Msaha closed lost intelligence complete breakdown showing documented reasons with case counts and percentages

    Analytics and Trend Reporting

    We added trend views that highlight what is happening across time, status, and geography. The team can spot where demand is strongest, which pipeline stages need attention, and how performance shifts week to week. Everything is built for action, not vanity charts that sit unused.

    Msaha analytics and trends overview showing growth metrics, top status, and top city insights Msaha time-based analytics chart showing lead volume trends over the last 30 days

    Geographic Insights for Multi-City Growth

    Msaha operates across multiple Saudi cities, so geography matters for resource allocation. We built a clear geographic distribution view showing top cities by count - Jeddah leading with 237 records, followed by Riyadh at 177, then Mecca, Dammam, Medina, and more. When you know where demand is heating up, you can expand supply and outreach with confidence.

    Msaha geographic distribution chart showing top cities by host and tenant count across Saudi Arabia

    Data Capture and Advanced Filters

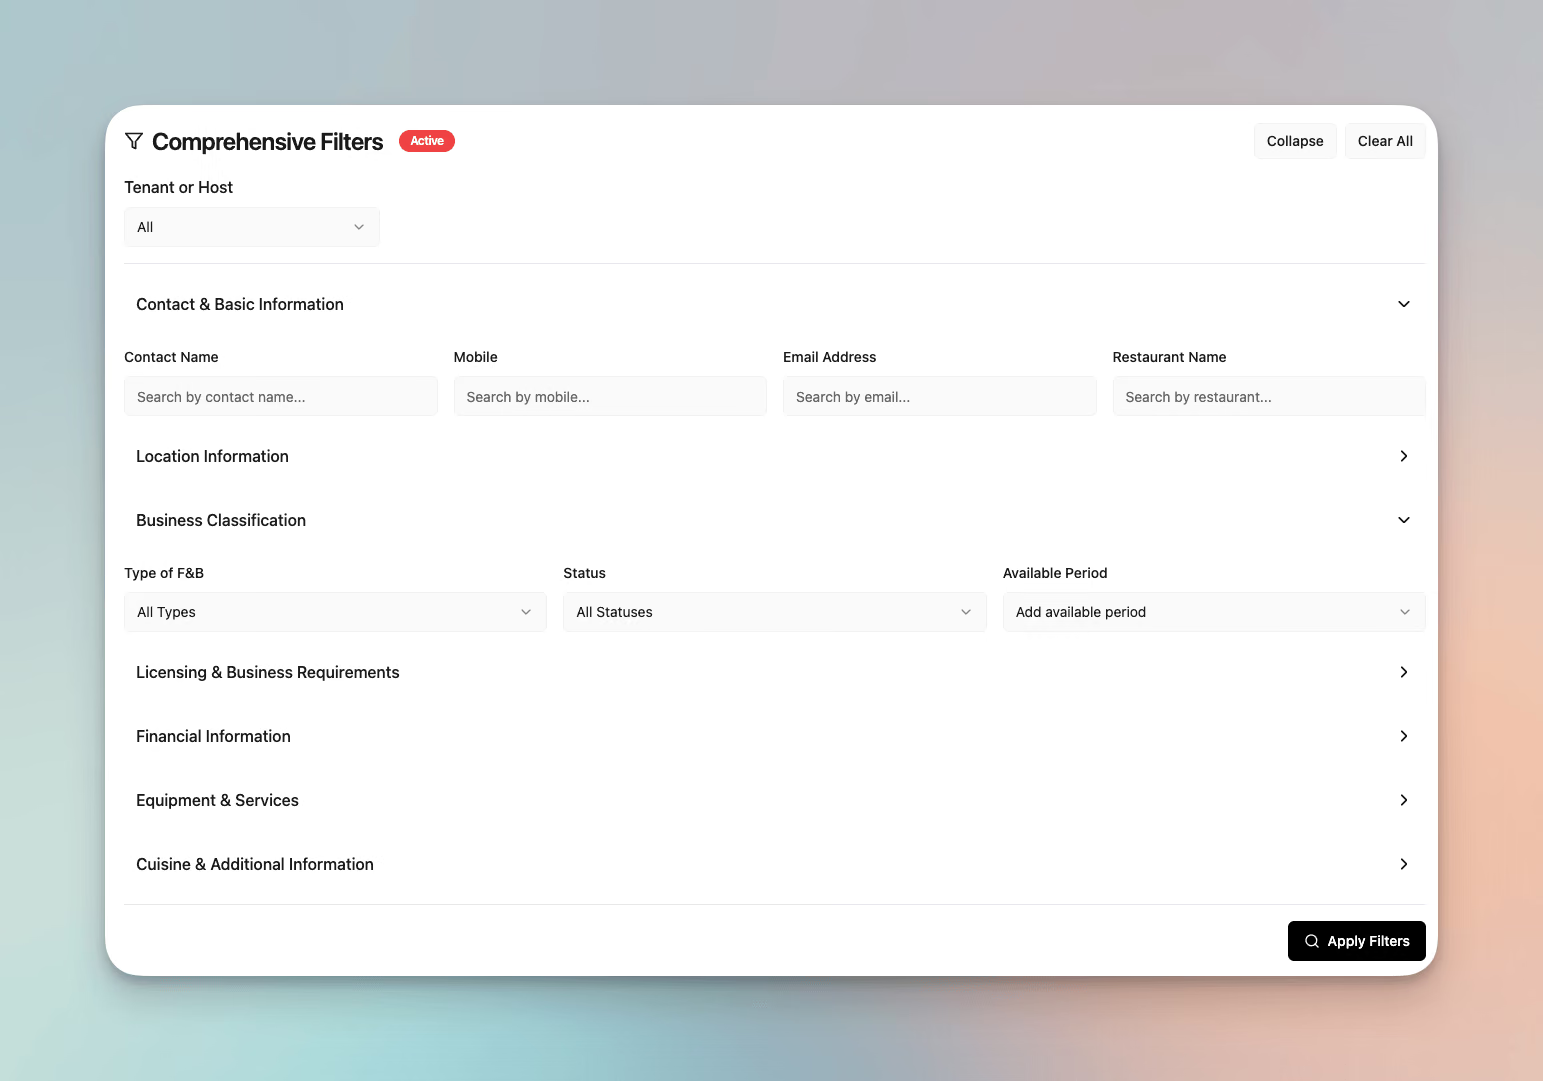
    We created guided multi-step forms for adding hosts and tenants, plus comprehensive filters for searching by contact details, location, business classification, F&B type, status, and more. Staff can pull the right records in seconds, export data cleanly, and keep records consistent across the entire team.

    Msaha guided multi-step form for adding new hosts and tenants with contact, location, and business information Msaha comprehensive filters panel with contact, location, business classification, and equipment search options

    Why This Matters

    A marketplace lives or dies on matching quality and operational speed. Msaha now has a platform that keeps data clean, makes AI host-tenant matching practical, and turns reporting into a daily habit instead of a monthly chore. For SoudCoh, this is another example of building scalable internal dashboards that help teams move faster and smarter - from Melbourne to global markets like Saudi Arabia.

    Services Delivered

    Internal dashboard UX and UI
    Host and tenant CRM system
    AI-powered matching logic
    Pipeline statuses and automation
    Closed lost tracking and reporting
    Analytics, trends, and geography views
    Advanced filters, search, and export
    Admin roles and permissions setup

    Results

    Once the platform went live, Msaha gained a single source of truth across hosts, tenants, and performance. The team could finally track outcomes consistently, identify where deals drop off, and use real data to improve matching and follow-ups. The dashboard also made it easier to scale operations across Saudi cities without adding chaos to the workflow.

    3,562 Total Records Tracked Centrally
    407 Hosts Onboarded and Searchable
    3,154 Tenants Managed in Pipeline
    66 Qualified Leads Ready to Action
    2,677 Closed Lost Reasons Documented
    237 Top City Activity (Jeddah)

    Conclusion

    Msaha's website sells a bold promise: help restaurants turn idle kitchen hours into income and help food brands launch faster. To deliver that promise consistently, they needed more than a public marketplace. They needed a strong internal engine.

    SoudCoh built that engine. The result is a purpose-built internal dashboard that gives the team clarity, speed, and better matching confidence. Instead of wrestling with disconnected tools, staff can manage hosts and tenants in one place, generate AI-driven match recommendations, and track every outcome - including why deals were lost.

    That last part matters because it turns everyday operations into a learning loop. Over time, Msaha can improve targeting, tighten qualification, and lift conversion without guesswork. For businesses building a marketplace or managing high-volume leads, this is what a dedicated platform should do: make growth simpler, not louder.

    If you are looking for a Melbourne-based web app team that builds systems that scale, SoudCoh is ready.

    Tags

    • Custom Web App
    • Dashboard
    • CRM & Automation
    • Lead Generation

    That is one account. Yours is a different one.

    We read your ads, your search presence and your tracking the same way this one was read, and tell you what we would change first.
    What every number on this page actually means.

    Marketing words get used loosely, and a loose word can make a small result look like a big one. Here is exactly what we mean by each of them.

    Conversion
    One real action by one real person: a phone call that lasted long enough to be a conversation, a submitted enquiry form, a booking, or a purchase. Not a page view and not a form that merely loaded.
    Cost per job · cost per lead
    The advertising money spent, divided by the number of those actions. It is the only figure that tells you whether the advertising is worth doing, which is why we publish it next to the count.
    Conversion rate
    The share of people who clicked the ad and then did the thing. A high click count with a low conversion rate usually means the ad and the page are promising different things.
    Ad spend
    Money that went to the advertising platform, not to us. Our management fee is separate and is never included in a cost-per-job figure, because mixing them would flatter the number.
    The measurement window
    The dates the figure covers, named every time. Where a study covers a launch, the clock starts the day campaigns went live — not the day the graph started looking good.
    A starting point
    Where a study knows what a figure was before the work began, that number is printed next to the one it became. Where the account had no history to compare against, the result is printed on its own rather than measured from a number nobody recorded.
    Qualified lead
    An enquiry that matched the service and the service area, so it was worth someone picking up the phone for. Where a study says qualified, somebody checked.
    An anonymised client
    Government, council and cultural-institution engagements are published as sector and jurisdiction only. The work and the measured outcome are described in full; the organisation is not named.

    One more, because it matters most: nothing on this page is a guarantee. It is a record of what happened on one account, in one market, at one budget.

    SoudCoh Compound™

    This page exists because of two of the six stages.

    Compound is how our team works on any account — six stages every change passes through. Two of them are why there is anything honest to publish.

    • Meter

      If it can't be measured, it doesn't get bought.

      Before a dollar moves, every action worth money to the business is tracked as itself — calls, forms, bookings, purchases — with values attached. Without that stage there is no honest number to publish afterwards.

    • Ledger

      Every change we make becomes a record you can open.

      Every change lands in a dated record as it happens — what was added, what was stopped, what was rewritten and what it cost. Writing this page afterwards was reading a file, not reconstructing a memory.

    If you want one of these

    What actually happens after the first call.

    No mystery and no lock-in before you have seen anything. This is the sequence every account on this site went through.

    1. The call

      Thirty to forty-five minutes, free

      What you sell, who buys it, and what one customer is worth to you. No deck. You leave with a real number for your situation rather than a range.

    2. Week 0

      The audit

      We open your account — or your competitors' ground, if you do not have one yet — and write down every leak we can find. That list is yours whether or not you work with us.

    3. Week 1

      The build

      Everything the account needs before it can spend a dollar: what it will bid on, what it must never pay for, the ad copy, the assets, the landing pages and the tracking. A second person checks all of it before anything is live.

    4. Day one

      You press go

      Campaigns are created paused, every time, so you can read the whole build first. You activate when you are ready, not when we are.

    5. Days 1–14

      The clean

      The busiest fortnight your account will ever have. Search terms read daily, waste negated, early winners promoted, ad copy iterated against what is actually being served.

    6. From there

      Rhythm

      Weekly optimisation, reporting on a fixed cadence whether the news is good or bad, and a proper conversation each quarter about where the next block of budget should go.

    Before you ask us anything

    Here is what everybody asks first.

    FAQ

    The questions this raises.

    Whether the figures are real, how they were measured and over what length of window, what it costs, and whether any of it would hold for your business.

    The first call is free and there is no deck.

    Book a call
    Are the figures in this case study real?

    Yes. Every number on this page was read out of the client's own advertising account and is printed here exactly as the study publishes it, beside the period it covers. The dashboard and ad images are screen-grabs of that account rather than recreations. If one of these figures matters to your decision, ask about it on the first call and we will walk you through where it came from.

    How were these numbers measured, and over what window?

    Every figure on the page is printed beside the period it belongs to. We publish the LENGTH of a measurement window and the year, and withhold the exact dates — when a client advertised, and how their trading calendar looks, is their commercial information rather than ours. A conversion means one real action by one real person: a phone call that lasted long enough to be a conversation, a submitted enquiry form, a booking, or a purchase. Not a page view, and not a form that merely loaded.

    Would this work for my business?

    We cannot promise you the same numbers, and nobody honestly can. What this page tells you is what was achievable in that market, at that budget, for that service. Your competition, your service area, your margins and what one customer is worth to you all move the answer. On the first call we build the picture from your figures rather than someone else's, and if the honest answer is that this channel is wrong for you right now, we will say so.

    Why does this study show a result but not a starting point?

    Because in most of these engagements there was nothing reliable to start from. A brand-new advertising account has no history, and a business that was tracking enquiries on paper or in a spreadsheet has no comparable figure either. Where a real before-number exists we print it next to the after-number, so you can see the movement rather than take our word for it. Where it does not, we print the result on its own. Back-solving a starting point from a percentage would make the page look better and mean less.

    Would my business get the same result?

    We cannot tell you that, and nobody honestly can. What this page tells you is what was achievable in that market, at that budget, with that service. Your competition, your service area, your margins and what a customer is worth to you all move the answer. On the first call we build the picture from your numbers rather than from someone else's, and if the honest answer is that this channel is wrong for you right now, we will say so.

    How much would this cost to run?

    Two separate numbers. Your ad spend goes to the platform, and what it needs to be depends on how competitive your market is and how many jobs you want — the smallest companies we work with invest a minimum of A$3,000 a month, and our largest clients run multiple eight figures a month across paid channels. Our management fee is separate and scales with the work. The first call is free and you leave it with a real figure for your situation.

    How quickly could we start seeing enquiries?

    It depends on the channel. Paid search meets demand that already exists, so calls and forms can arrive within hours of launch, and the first two to four weeks are an optimisation period where waste is cut daily. Most accounts settle into their best rhythm around 60 to 90 days. SEO, content and brand work run on a much longer clock — months rather than weeks — and we will tell you which one your situation actually needs.

    Am I locked into a long contract?

    No long-term lock-in. We would rather keep the work because it is producing than because a contract says you have to stay. What we do ask for is enough runway to be fair to the account — a campaign judged on its first ten days is being judged during the part where we are still cutting waste out of it. Terms are put in front of you in plain English before anything is signed.

    More accounts, same discipline.

    Studies from the same kind of work, so you can see how the pattern holds across different businesses.

    Everything above was delivered by one of a handful of things we do. These are the ones this account leant on, written up in full rather than summarised.

    The briefing behind the work.

    The case study records what happened. These two explain the channel, measurement or operating decision that made the result interpretable in the first place.

    The ownership, governance and operating constraints behind an internal data product. That case is argued in Why first-party data projects stall outside tier one.

    A practical accountability question for any workflow that places a model between an operator and an output. The other half of it is set out in When AI drafts the brief, who owns the message?.

    The work behind this one is written up in full under how we scope and build custom software, and the ninety-day plan that produced results like these sets out the sequence in order.

    Want results like this?

    Thirty minutes on your numbers rather than somebody else's, and a written list of what we would change first. Yours to keep either way.

    No pitch deck. No upsell. A real conversation and a written list of leaks.