
Electrician leads Sydney at $81.48 each in a 19-day period
Aus Electrical & Data Services · Electrical & Data · Sydney, NSW
The short version · a 19-day period in 2026
Aus Electrical and Data Services does electrical and data contracting across Sydney.
What follows is two measured periods lifted out of the account and reported without dates, on purpose. Across them the account was seen 901,856 times and converted just 1.25% of its 3,115 clicks, running at $246.89 per enquiry — a great deal of exposure buying very little work. The first period, 23 days long, delivered 20 enquiries at $163.34 each. The second then produced 19 enquiries and 15 phone calls from only 608 clicks, lifting the enquiry rate from 0.8% to 3.13% and the click-through rate from 0.31% to 0.69%. Cost per enquiry rose to $334.84 in that second period because the account stopped buying cheap, low-intent volume, and we print both figures.
The result.
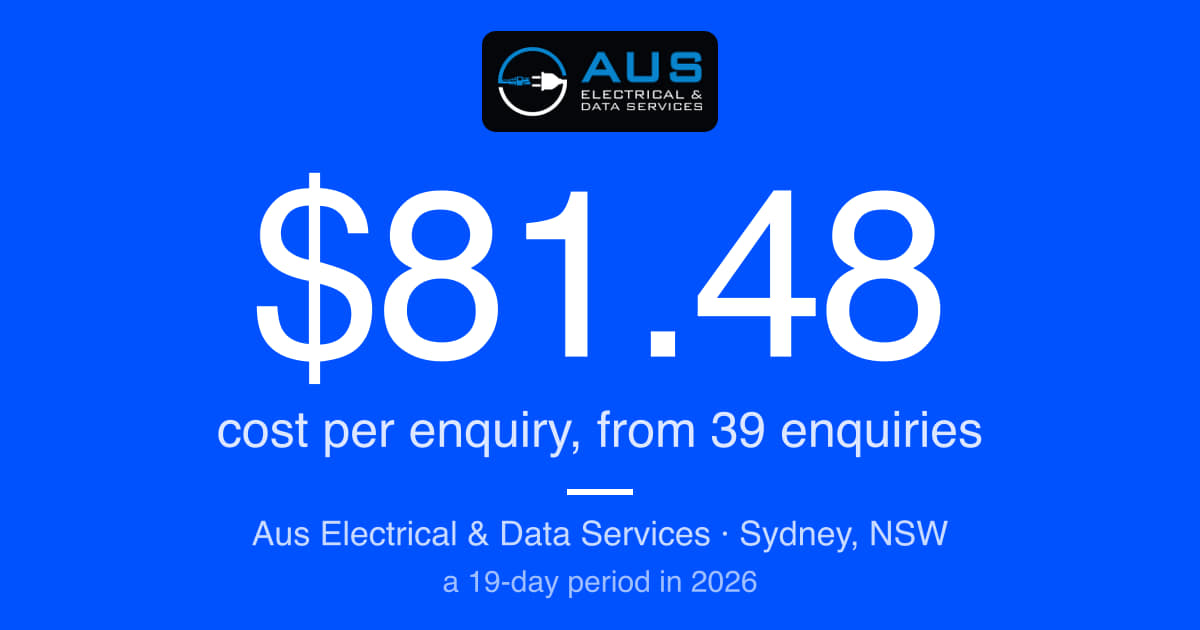
$81.48
cost per enquiry, from 39 enquiries
a 19-day period in 2026
89
enquiries at $85.03 each
a 30-day period in 2026
213
enquiries and 15 tracked phone calls
across the account's wider run
13.93%
click-to-enquiry conversion rate
a 19-day period in 2026
$98.63
cost per enquiry, account-wide
over the wider account
- Industry
- Electrical & Data
- Discipline
- Home Services
- Ad spend band
- $10K–$25K
- Measured over
- a 19-day period in 2026
Every figure above was read out of this client's live account and is reproduced exactly as the study publishes it. It is a record of what happened on one account, in one market, at one budget — not a forecast for yours.
What would this look like on your account?
Different market, different budget, different numbers. The first call is where we work out whether the same approach fits yours at all.
The case study
What moved for Aus Electrical & Data Services.
The short list
- Enquiries held steady — 20 in the first period, 19 in the second — while the second period's traffic was roughly a quarter of the first period's click volume.
- The enquiry rate rose from 0.8% of clicks in the first period to 3.13% in the second, an improvement of 291.72%.
- Phone calls went from 5 in the first period to 15 in the second.
- Cost per enquiry rose to $334.84 in the second period from $163.34 in the first, because the account stopped buying very cheap, very low-intent volume. We print both.
- 39 enquiries and 21 phone calls across the two periods together.
Each line above belongs to the period printed with it. None of them is an average across the account, and none of them is a forecast.
A phone that either rings with the right people or does not
Aus Electrical and Data Services does electrical and data work across Sydney — switchboards, power, cabling, comms racks, and the call-outs that come with all of it. One good commercial job pays for a month of marketing. A quiet fortnight is felt within a week. There is no marketing department here. There is a phone.
Contracting of this kind sits in an awkward commercial spot. Residential emergency work is urgent, small and fiercely contested. Commercial cabling is worth many times more per job, but the buyer is slower and much rarer — a builder, a facilities lead, an office fit-out manager who searches once and then decides over a week. Advertising has to reach both without paying commercial prices for residential curiosity.
When we looked at the account, exposure was not the problem. Across the two periods reported below — both picked out of the account and left undated on purpose — it was put in front of Sydney searchers 901,856 times. Plenty of people saw it.
What that exposure cost to turn into work was the problem. Those impressions produced 3,115 clicks over the same stretch, a click-through rate of 0.35%, and taken together the account ran at $246.89 per enquiry with just 1.25% of clicks becoming an enquiry. For an electrician chasing switchboard upgrades, data cabling and emergency call-outs, that is a number you feel in the bank account. Every dollar spent on a click from someone who was never going to book is a dollar that did not go into the van, the apprentice, or the next quote.
This is the ordinary failure mode of electrical advertising in a large city, and it is worth naming because from a distance it looks like success. A six-digit impression count reads beautifully on a report. It was also, here, a description of the problem. Bringing the cost of an enquiry down was never about buying more attention. It was about buying much less of the wrong kind.
What we took on
Two short stretches of trading, three campaigns running side by side, and 901,856 impressions to sort through — each one a decision about whether that search was worth paying for at all. We rebuilt the account around the enquiries that actually turn into booked work, with ads written to the specific job the customer is trying to get done rather than to the broad category they happen to fall into.
How that is done is our own work. It is granular, it happens continuously rather than being set once and forgotten, and it is why the numbers below moved.
This was a short run. We print both periods, including the one that looks worse on the headline metric, because the story only makes sense with both.
The result
In the first period, 23 days long, the account produced 20 enquiries at $163.34 each, from 2,507 clicks and 813,764 impressions. Alongside those enquiries it generated 5 phone calls.
Cost per enquiry is the first thing most people look at, so take the bad-looking version first. It climbed from $163.34 in the first period to $334.84 in the second. On its own that says the account got twice as expensive.
Set it beside the enquiry counts and it says something quite different. Twenty in the first, nineteen in the second — a difference of one. Now add the traffic. The second period bought 608 clicks from 88,044 impressions, roughly a quarter of the earlier click volume and around a tenth of its impressions, and produced almost the same number of enquiries. The enquiry rate went from 0.8% of clicks to 3.13%. Click-through rate went from 0.31% to 0.69% across the same two months, an improvement of 124.15%, and the share of clicks becoming an enquiry improved by 291.72%.
Phone calls tell it more bluntly. Five in the first. Fifteen in the second. Three times the calls from a quarter of the traffic.
Device data makes the shift concrete.
In the first period, desktop was served 89,267 impressions, drew 52 clicks and produced 1 enquiry. Nearly ninety thousand appearances for a single piece of work.
In the second, desktop served 23,703 impressions, drew 188 clicks and produced 9 enquiries. Tablet tells the same story in miniature: 225,168 impressions and 67 clicks in the first period, against 16,792 impressions and 19 clicks in the second.
- 20 enquiries at $163.34 each — a 23-day period in 2026
- 19 enquiries and 15 phone calls — a 27-day period in 2026
- 3.13% of clicks became an enquiry — the second period, up from 0.8% in the first
- 0.69% click-through rate — the second period, up from 0.31% in the first
- 39 enquiries and 21 phone calls in total — across both periods
- $246.89 per enquiry and a 1.25% enquiry rate taken over the two together
One of the three campaigns carried 16 of those enquiries on its own, at $108.04 each.
So why did cost per enquiry rise in the second period if the quality improved? Because the account stopped buying enormous volumes of very cheap, very low-intent attention. Those hundreds of thousands of cheap impressions were not free — they dragged an average down while contributing almost nothing to the phone. Strip them out and what remains is dearer per click and far more likely to be a job. We print the $334.84 rather than burying it, because a case study that only shows a metric moving the flattering way is not evidence of anything.
What it meant for the business
39 enquiries and 21 phone calls across two short periods is a real pipeline for a contracting business. A call from somebody with a dead switchboard or a half-finished data run is not a lead in the abstract. It is a van booked, a quote written, a job that either lands or does not. Going from 5 calls in the first period to 15 in the second changed the daily texture of the place: fewer tyre-kickers on the line, more people who already knew what they needed done and wanted a date.
That matters more in electrical and data than in most trades, because of who answers the phone. Usually the owner, or a coordinator with plenty of other work on. Every unqualified call costs a few minutes of somebody who is otherwise billable, and a hundred of them costs a day nobody planned to lose. Trebling the call count while cutting the click count meant the same person spent less time screening and more time quoting.
It also hands the business a number to plan against. When you know 19 enquiries in the second period came from 608 clicks, you can talk sensibly about what a busier month would take.
Questions we get from Sydney electrical and data contractors
Why would a higher cost per enquiry count as progress?
Because cost per enquiry is an average, and averages can be held down by traffic that never converts. In the first period this account paid for 2,507 clicks and got 20 enquiries. In the second it paid for 608 clicks and got 19. The later enquiries cost more each, $334.84 against $163.34, but the account bought a quarter of the clicks to land almost the same result. Judge those two periods on enquiries and calls, not on the average alone.
Are 901,856 impressions a good sign for an electrician in Sydney?
Not on their own. This account was seen 901,856 times across the two periods with a 0.35% click-through rate and a 1.25% enquiry rate. Volume of exposure is the easiest metric in any account to inflate and the least connected to the phone ringing. Given the choice we would take the second period's picture: 88,044 impressions and 15 phone calls.
Do commercial data jobs and residential call-outs need different advertising?
They behave differently, which is the whole difficulty. In this account one of the three campaigns produced 16 enquiries at $108.04 each while the blended figure across both periods was $246.89 — a wide spread between parts of the same account over exactly the same stretch of trading. Treating all electrical demand as one undifferentiated pool is what makes a blended number look the way that one does.
How long before a rebuilt account shows anything?
Here the movement was visible inside the second month: the first period to the next, enquiry rate 0.8% to 3.13%, calls 5 to 15. That is one account over two short periods, and it is not a promise about yours.
Talk to us
If you run an electrical or data business in Sydney and you are paying for plenty of clicks and not enough call-outs, that gap is fixable. Send us the account and we will tell you honestly what is happening inside it — which searches are earning, which are quietly expensive, and whether the impression count you have been shown means anything at all.
Tags
- Electrical & Data
- Sydney, NSW
- $10K–$25K
That is one account. Yours is a different one.
We read your ads, your search presence and your tracking the same way this one was read, and tell you what we would change first.
What every number on this page actually means.
Marketing words get used loosely, and a loose word can make a small result look like a big one. Here is exactly what we mean by each of them.
- Conversion
- One real action by one real person: a phone call that lasted long enough to be a conversation, a submitted enquiry form, a booking, or a purchase. Not a page view and not a form that merely loaded.
- Cost per job · cost per lead
- The advertising money spent, divided by the number of those actions. It is the only figure that tells you whether the advertising is worth doing, which is why we publish it next to the count.
- Conversion rate
- The share of people who clicked the ad and then did the thing. A high click count with a low conversion rate usually means the ad and the page are promising different things.
- Ad spend
- Money that went to the advertising platform, not to us. Our management fee is separate and is never included in a cost-per-job figure, because mixing them would flatter the number.
- The measurement window
- The dates the figure covers, named every time. Where a study covers a launch, the clock starts the day campaigns went live — not the day the graph started looking good.
- A starting point
- Where a study knows what a figure was before the work began, that number is printed next to the one it became. Where the account had no history to compare against, the result is printed on its own rather than measured from a number nobody recorded.
- Qualified lead
- An enquiry that matched the service and the service area, so it was worth someone picking up the phone for. Where a study says qualified, somebody checked.
- An anonymised client
- Government, council and cultural-institution engagements are published as sector and jurisdiction only. The work and the measured outcome are described in full; the organisation is not named.
One more, because it matters most: nothing on this page is a guarantee. It is a record of what happened on one account, in one market, at one budget.
What this study cannot tell you is what the same figure looks like on your account — so work out your own quote-to-win rate, with your own click price and close rate. It takes about a minute and asks for nothing.
This page exists because of two of the six stages.
Compound is how our team works on any account — six stages every change passes through. Two of them are why there is anything honest to publish.
Meter
If it can't be measured, it doesn't get bought.
Before a dollar moves, every action worth money to the business is tracked as itself — calls, forms, bookings, purchases — with values attached. Without that stage there is no honest number to publish afterwards.
Ledger
Every change we make becomes a record you can open.
Every change lands in a dated record as it happens — what was added, what was stopped, what was rewritten and what it cost. Writing this page afterwards was reading a file, not reconstructing a memory.
What actually happens after the first call.
No mystery and no lock-in before you have seen anything. This is the sequence every account on this site went through.
- The call
Thirty to forty-five minutes, free
What you sell, who buys it, and what one customer is worth to you. No deck. You leave with a real number for your situation rather than a range.
- Week 0
The audit
We open your account — or your competitors' ground, if you do not have one yet — and write down every leak we can find. That list is yours whether or not you work with us.
- Week 1
The build
Everything the account needs before it can spend a dollar: what it will bid on, what it must never pay for, the ad copy, the assets, the landing pages and the tracking. A second person checks all of it before anything is live.
- Day one
You press go
Campaigns are created paused, every time, so you can read the whole build first. You activate when you are ready, not when we are.
- Days 1–14
The clean
The busiest fortnight your account will ever have. Search terms read daily, waste negated, early winners promoted, ad copy iterated against what is actually being served.
- From there
Rhythm
Weekly optimisation, reporting on a fixed cadence whether the news is good or bad, and a proper conversation each quarter about where the next block of budget should go.
Before you ask us anything
Here is what everybody asks first.
The questions this raises.
Whether the figures are real, how they were measured and over what length of window, what it costs, and whether any of it would hold for electricians.
The first call is free and there is no deck.
Book a callWhy would cost per enquiry go up and still count as progress?
Because cost per enquiry is an average, and averages can be held down by traffic that never converts. In the first period this account paid for 2,507 clicks and got 20 enquiries. In the second it paid for 608 clicks and got 19. The later enquiries cost more each, $334.84 against $163.34, but the account bought a quarter of the clicks to get almost the same result. Judge the two periods on enquiries and calls, not on the average alone.
Are 901,856 impressions a good sign for an electrician in Sydney?
Not on their own. This account was seen 901,856 times across the two periods we are reporting, with a 0.35% click-through rate and a 1.25% enquiry rate. Volume of exposure is the easiest metric in any account to inflate and the least connected to the phone ringing. We would rather have the second period's picture: 88,044 impressions and 15 phone calls.
Do commercial data jobs and residential call-outs need different advertising?
They behave differently, which is the whole difficulty. In this account one of the three campaigns produced 16 enquiries at $108.04 each while the blended figure across both periods was $246.89 — a wide spread between parts of the same account over exactly the same stretch of trading. Treating all electrical demand as one undifferentiated pool is what makes a blended number look the way that one does.
How long before a rebuilt account shows anything?
Here the movement was visible inside the second month: the first period to the next, enquiry rate 0.8% to 3.13%, calls 5 to 15. That is one account over two short periods and it is not a promise about yours.
Are the figures in this Aus Electrical & Data Services case study real?
Yes. Every number on this page was read out of the client's own advertising account and is printed here exactly as the study publishes it, beside the period it covers. The dashboard and ad images are screen-grabs of that account rather than recreations. If one of these figures matters to your decision, ask about it on the first call and we will walk you through where it came from.
How were these numbers measured, and over what window?
The headline figure covers a 19-day period in 2026, and every other figure on the page is printed beside the period it belongs to. We publish the LENGTH of a measurement window and the year, and withhold the exact dates — when a client advertised, and how their trading calendar looks, is their commercial information rather than ours. A conversion means one real action by one real person: a phone call that lasted long enough to be a conversation, a submitted enquiry form, a booking, or a purchase. Not a page view, and not a form that merely loaded.
How much was being spent to produce this?
The study publishes this account's advertising spend as a band — $10K–$25K — rather than an exact figure, because the precise number is the client's business. Our management fee is separate from that and is never folded into a cost-per-lead figure anywhere on this site; mixing the two would flatter every number on the page.
Would this work for electricians like mine?
We cannot promise you the same numbers, and nobody honestly can. What this page tells you is what was achievable in that market, at that budget, for that service. Your competition, your service area, your margins and what one customer is worth to you all move the answer. On the first call we build the picture from your figures rather than someone else's, and if the honest answer is that this channel is wrong for you right now, we will say so.
More accounts, same discipline.
Studies from the same kind of work, so you can see how the pattern holds across different businesses.
Home Services
Brisbane Plumbing Leads at $176.78 Each in a 12-Day Period
Plumbing leads in Brisbane — ABZ Plumbing took 13 enquiries at $176.78 each in a 12-day period in 2026, and 19 in total across the wider account.
Read case study
Cleaning Services
Commercial Cleaning Melbourne: 26 Leads at $109.06 in a 20-Day Period
Commercial cleaning leads in Melbourne — Robust Facility Solutions took 26 enquiries at $109.06 each in a 20-day period in 2026, and 31 across the wider account.
Read case study
Automotive & Transport
Not-At-Fault Accident Claims Sydney: 26 Enquiries at $125.64 Each
Not-at-fault accident claim leads in Sydney: Hybrid Autos took 26 enquiries at $125.64 each across a 32-day period in 2026, 11 of them phone calls.
Read case study
More electricians we have published.
One account proves very little on its own. The closest neighbour to this one is Electrician leads Sydney: 262 enquiries in a 30-day period; its window is a 30-day period in 2026. The rest of the trade is below, with what each one is known for and how long that figure covers.
- Electrician leads Sydney: 262 enquiries in a 30-day period262enquiries in the measured period — a 30-day period in 2026
- Electrician leads Sydney: 35 enquiries in a 13-day period35Electrical enquiries — a 13-day period in 2026
- Electrician leads Sydney: 59 enquiries in a 27-day period$138.74cost per electrical enquiry — a 27-day period in 2026
The work that produced this.
Everything above was delivered by one of a handful of things we do. These are the ones this account leant on, written up in full rather than summarised, alongside the page written for electricians generally.
- What this looks like for other electriciansThe same work written up for electricians specifically — what an enquiry tends to cost in this trade, where it comes from, and what a business your size should expect from it.
- How trades accounts are built hereThe channel order we use for a home services business, what it costs to run, and what the first ninety days actually produce.
- Winning the suburbs you already serviceService-area work: the map pack, review velocity and the pages that make a suburb claim credible.
- Booked jobs, not just phone callsThe difference between a busy phone and a full diary is qualification, and it is fixable at the ad rather than at the office.
The briefing behind the work.
The case study records what happened. These two explain the channel, measurement or operating decision that made the result interpretable in the first place.
Why the primary and secondary categories must match the work a business actually wants. That case is argued in Google Business Profile categories as a silent rank constraint.
The profile and service-area rules for the mobile businesses represented throughout this library. The other half of it is set out in Ranking a service-area business without publishing a storefront.
The work behind this one is written up in full under what this looks like for other electricians, and the operating sequence behind every study on this site sets out the sequence in order.
Want results like this?
Thirty minutes on your numbers rather than somebody else's, and a written list of what we would change first. Yours to keep either way.
No pitch deck. No upsell. A real conversation and a written list of leaks.